
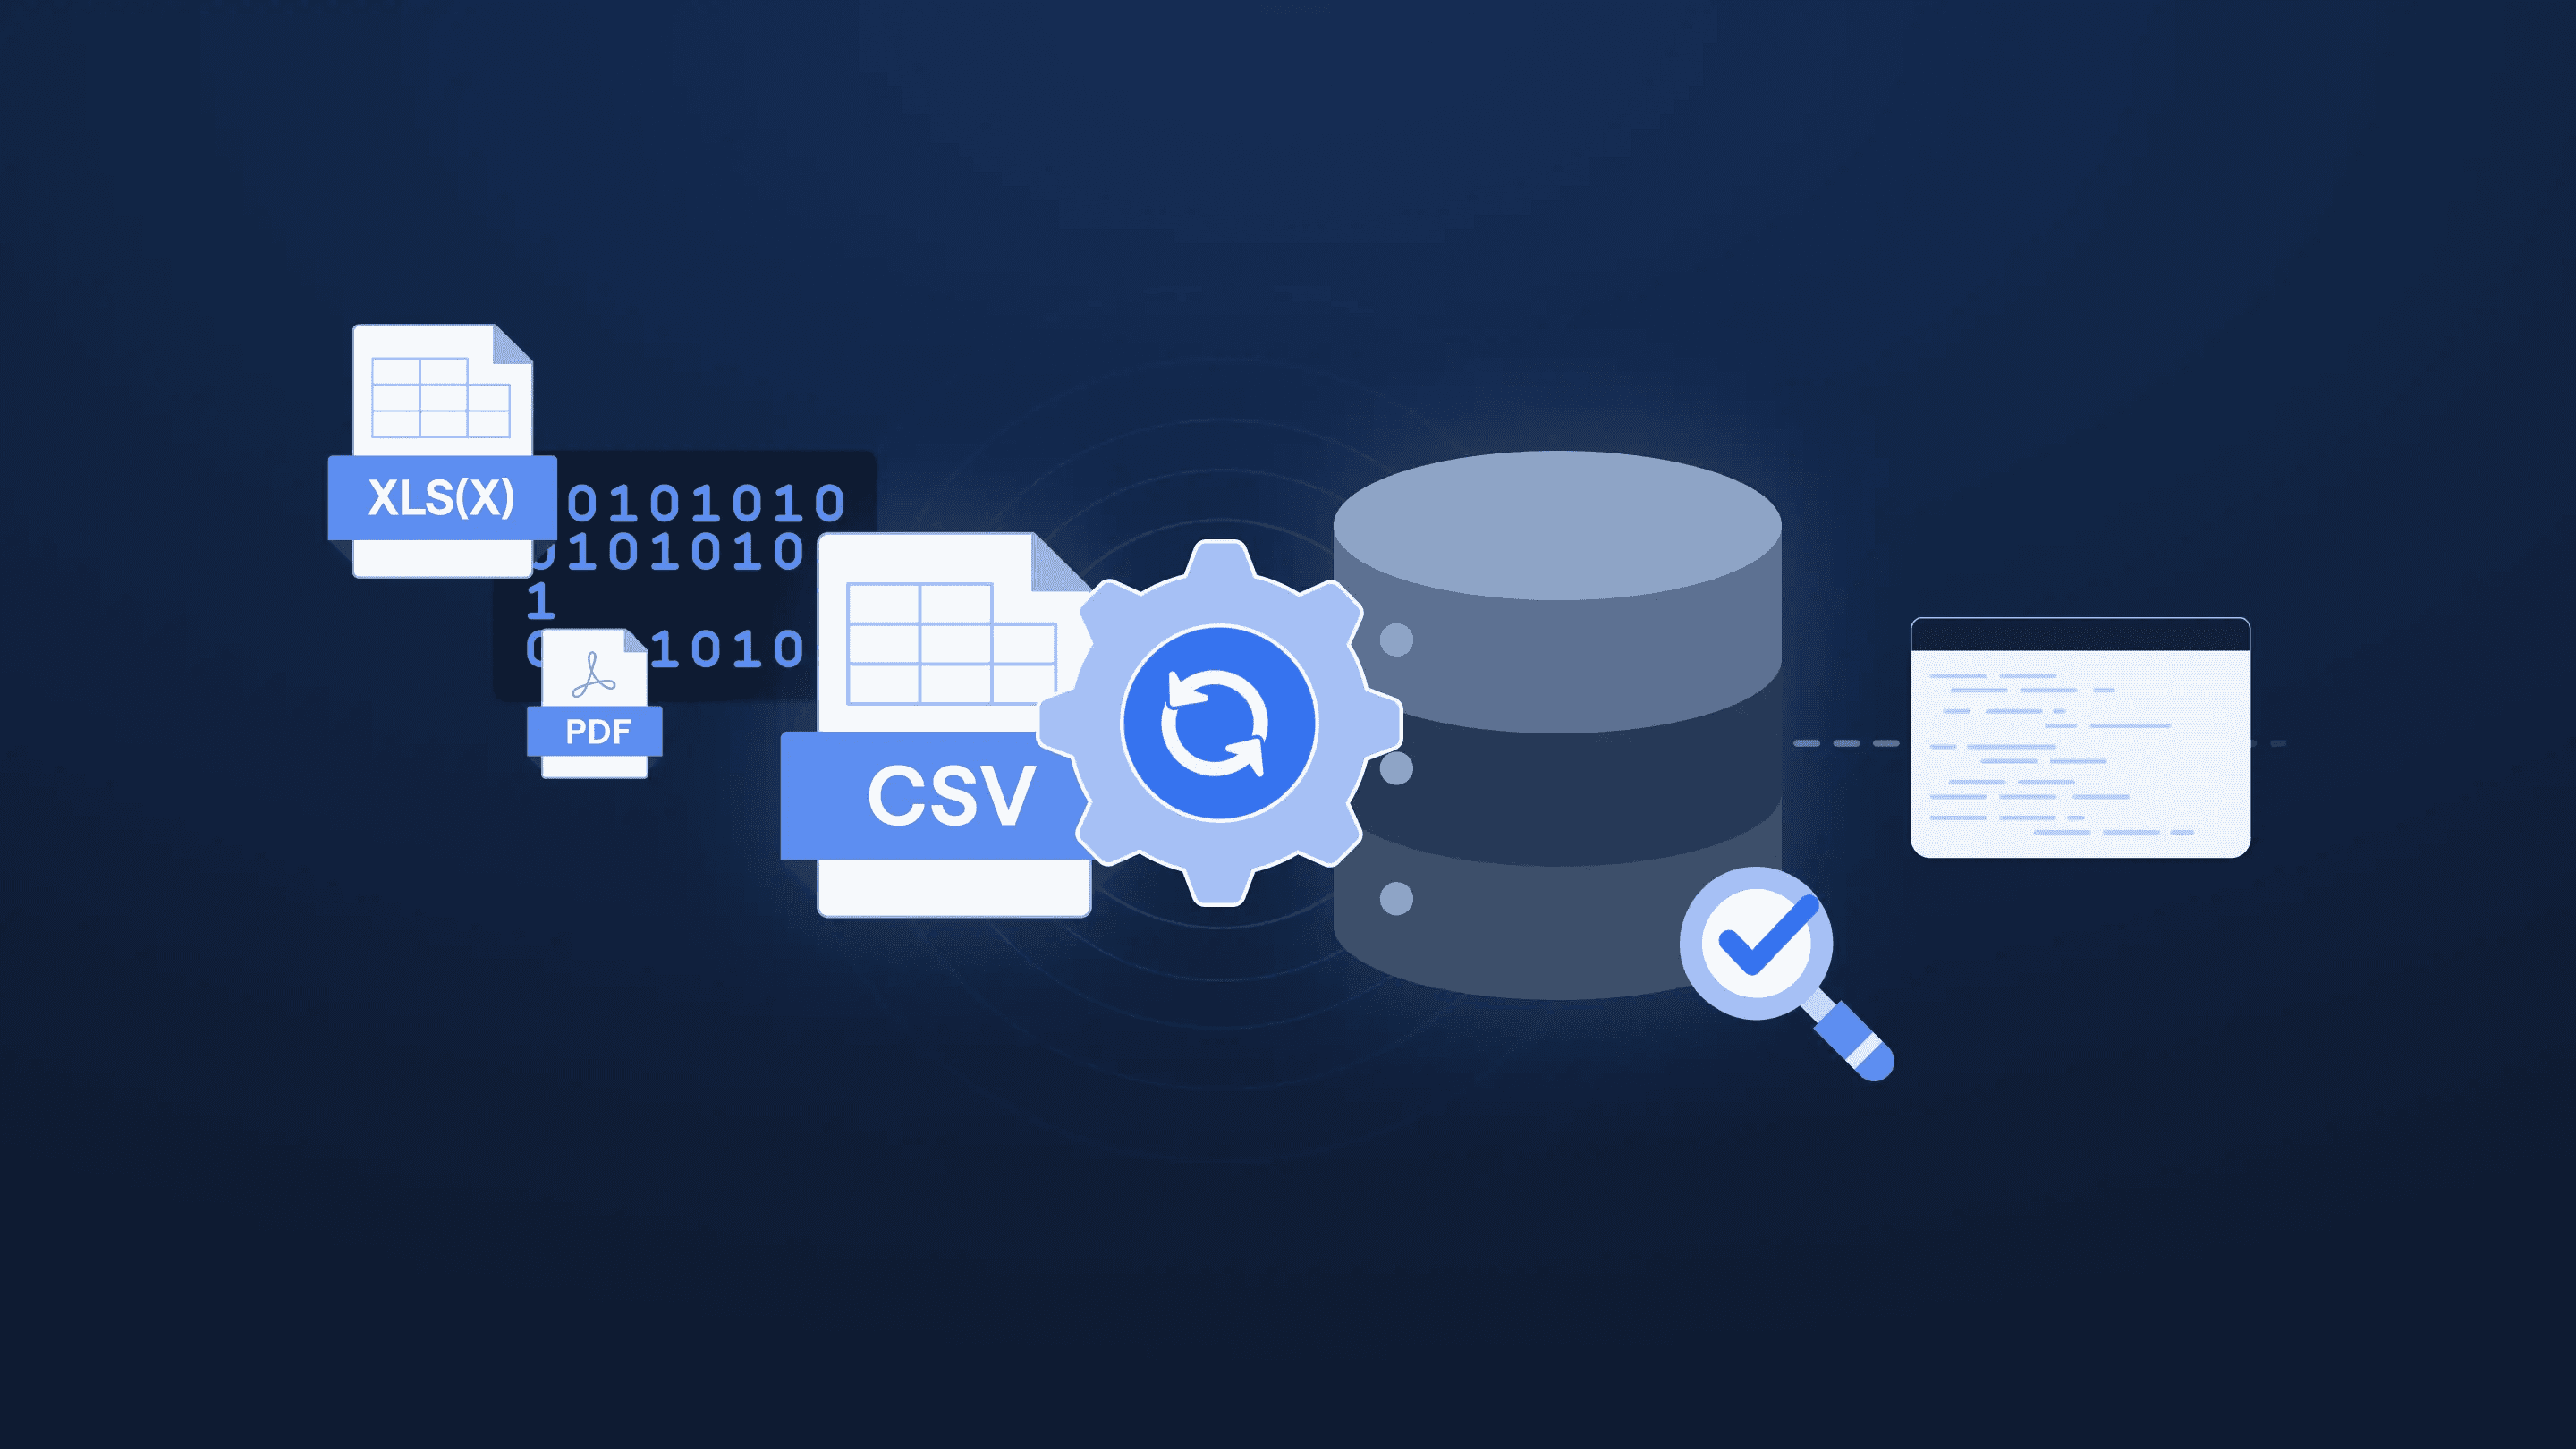
Every team faces messy inputs: sales spreadsheets, server logs, and CRM exports that do not line up. Data Transformation Techniques turn that mess into clean tables for reporting and machine learning, covering ETL, data cleansing, data wrangling, and real-time streaming. Which tool fits your stack, speeds up data preparation, and maintains high data quality?
To help readers know the 5 Best Data Transformation Tools and Data Transformation Techniques in 2025, this guide compares data integration options, pipeline automation, connectors, metadata management, and migration workflows so you can choose with confidence.
Spreadsheet AI Tool offers a simple way to prototype transformations inside a familiar spreadsheet so you can test mappings, validate data quality, and compare the five candidates without writing code.
Summary
Data preparation dominates analyst time: 80% of data scientists report spending most of their time cleaning and organizing data, displacing insight generation.
Automating cleanup into repeatable pipelines and using in-warehouse or streaming transforms can reduce data processing time by up to 60%, enabling faster dashboard and model iteration.
Performance techniques like pushdown execution, chunked processing, and parallel workers can achieve up to 50% reductions in processing time in practical benchmarks, so judge tools by sustained throughput, not demos.
Five capabilities are nonnegotiable for durable pipelines: robust cleaning, flexible reshaping, deep connectivity, repeatable automation, and scalability. 80% of companies report that these tools have significantly improved decision-making.
Expect three recurring operational costs, and plan for coordination during handoff. While real gains are evident in practice, for example, one team cut manual cleanup from eight hours to two.
This is where Numerous's ‘Spreadsheet AI Tool’ fits in: it lets teams prototype and validate transformations in a familiar spreadsheet, so they can test mappings, preview fixes, and compare candidates without writing code.
Table Of Contents
What is Data Transformation?
Data transformation is the operational engine that turns chaotic inputs into reliable signals you can act on, and getting it right determines whether your analytics are trusted or ignored. When transformation is treated as an afterthought, reports stall, models misfire, and teams spend their days firefighting instead of improving outcomes.
Why do pipelines break so often?
This pattern appears across SaaS analytics and connected-device projects: data arrives from apps, CRMs, sensors, and third-party AI systems in mismatched formats, with missing keys and duplicate records, and nothing simply lines up. That mismatch creates a daily grind of manual joins, ad hoc fixes, and brittle scripts that sap momentum and morale.
Why does cleanup eat so much of our time?
The human cost is plain to see, which explains why, in a 2025 survey, 80% of data scientists spend most of their time cleaning and organizing data, highlighting how preparatory work displaces insight generation. You lose senior brainpower to routine correction; analysts become data janitors, and product questions wait in the queue.
Can transformation also speed things up?
Yes, and not marginally. When teams move cleanup into automated, repeatable pipelines and leverage in-warehouse processing or streaming transforms, throughput improves dramatically, as shown by Tech Innovations Report 2025. Data transformation can reduce data processing time by up to 60%, according to a 2025 report that ties structured transformation work to clear runtime gains. That performance boost is what lets you iterate on dashboards and models during business hours instead of waiting overnight.
Most teams manage this by stitching scripts and one-off SQL because that approach is familiar and moves fast early on. As volumes and sources grow, those scripts fragment, tests vanish, and debugging turns into a scavenger hunt. Teams find that platforms like Spreadsheet AI Tool centralize connectors, provide versioned models, and support both batch and streaming transforms, compressing reconciliation from days to hours while preserving audit trails.
What tradeoffs should we plan for?
If you prioritize speed, you must accept additional governance work; if you prioritize strict lineage, expect slower initial delivery. Low-code interfaces widen access but can obscure complex joins; hand-written SQL gives control but scales into a maintenance burden. Choose tools that let you shift modes: enable analysts with no-code options, while keeping engineering-grade controls for production pipelines. Think of transformation like a kitchen: the recipes matter, but the layout, knives, and mise en place determine whether you feed ten people or ten thousand. The following section will expose the single set of capabilities that separates tools that tinker from tools that sustain absolute scale, and it will surprise you.
Related Reading
5 Features of a Data Transformation Tool

The five features are straightforward and nonnegotiable: robust cleaning, flexible reshaping, deep connectivity, repeatable automation, and true scalability. Get these right and teams stop firefighting and start trusting outputs again; miss any one and the pipeline becomes brittle under real workloads.
1. How should a tool clean messy data without guessing?
Cleaning must combine deterministic rules with probabilistic detection, and it must make intent visible. Use fast sampling to propose fixes, show a preview of affected rows, and attach a confidence score to each transformation so reviewers can accept or tweak rules before they touch production. That pattern matters because teams burn hours reconciling minor edits, and the emotional toll is real; it is exhausting when formats keep flipping. The same fixes are applied manually every week. Numerous supports this workflow with previewed rule suggestions, inline validation, and audit records so you can test fixes on a slice and then promote them safely.
2. How do you reshape data when source schemas don’t agree?
Reshaping should be schema-aware, not just column surgery. A tool needs inferred types, safe coercions, and mapping templates that preserve originals so you can rollback without hunting through versions. Expect fuzzy-join helpers for inconsistent keys, column-pivot ergonomics that keep lineage, and lightweight metadata (labels, units) that travel with the table. In practical terms, this means you can flip a dataset from wide to long or merge three vendor feeds into one canonical table without hand-editing formulas, and you retain provenance for every field.
3. What connection patterns prevent reports from breaking?
Connectors must be resilient. Prefer incremental syncs with watermarking, idempotent writes, token refresh handling, retry logic, and schema-change detection. When sources disconnect or change, the system should surface the drift, quarantine bad batches, and allow quick remediation without rerunning everything. This addresses a typical pattern across analytics and marketing operations, where disconnected data forces teams to perform manual joins and error-prone reconciliations that waste entire days each week.
Most teams handle recurring transforms by re-running ad hoc scripts because it is familiar and require no new approvals. That works until schedules drift, stakeholders multiply, and errors compound into missed reports. Solutions like Numerous provide saved, parameterized workflows with scheduling, built-in testing, and one-click rollbacks, so teams can replace fragile manual re-runs with predictable pipelines that preserve history and reduce human error.
How do you measure true scalability and performance?
Judge a tool by how it behaves under realistic load, not in a demo. Look for pushdown execution to warehouses, chunked processing for large files, parallel workers, and streaming options for near-real-time needs. Observe how the platform surfaces slow stages and whether it offers non-destructive retries and partial rollbacks.
A practical benchmark is throughput under sustained load, because when spreadsheets freeze or scripts time out, deadlines slip, and senior people get pulled into reconciliation. A 2025 note from Superblocks Blog, Data transformation tools can reduce data processing time by up to 50% explains why these performance tactics translate directly into faster cycles and fewer late nights.
Why invest in these five capabilities now?
Because decision quality depends on them, platforms that combine cleanable rules, safe reshaping, resilient connectors, repeatable automation, and engineered throughput turn data from a recurring cost into an accelerating asset, and that shift shows up in outcomes. According to Superblocks Blog, 80% of companies report that data transformation tools have significantly improved their decision-making processes. In 2025, that adoption is what separates teams that react from those that plan proactively.
What we didn’t cover earlier is how these features interact under failure: the real value lies not in each capability alone, but in the way the system detects drift, isolates bad batches, and lets you repair without erasing audit trails. There is a surprising tradeoff ahead that will make many popular choices look less durable than they seem.
Related Reading
5 Best Data Transformation Tools in 2025
Numerous leads the pack, followed by dbt, Matillion, Integrate.io, and Talend, each filling a distinct role from spreadsheet-first cleanup to warehouse-grade modeling and enterprise governance. Pick based on who touches the data most often, where you perform production transforms, and how much engineering overhead you can tolerate.
1. How do you choose the right tool for your team?
Match the tool to the locus of control. If analysts and marketers own the dataset day to day and need fast, exploratory fixes, favor a spreadsheet-first, natural-language tool. If analytics engineers own lineage and testing inside a cloud warehouse, choose dbt for versioned SQL models and automated tests. If you need broad SaaS connectivity with minimal engineering lift, pick a low-code ELT like Integrate.io or a cloud-native option such as Matillion; for complex hybrid governance and metadata needs, Talend is the safer bet. These are tradeoffs, not flaws, and deciding early saves months of rebuild work.
2. What happens when you try to run everything on one platform?
Most teams handle early-stage reporting with a single, familiar tool to minimize coordination. That works until sources multiply and responsibilities split; then manual fixes, ad hoc scripts, and untracked formula changes begin to compound. Teams find that platforms like Numerous ease that breakage by letting non-engineers automate cleaning and enrichment inside the spreadsheet, while still handing off cleaned tables to engineering-grade tools for modeling and production deployment.
3. How much time and money can you actually reclaim?
Choose tools that shorten cycles where they matter most, because time saved in prep compounds into faster experiments and less context-switching for senior analysts. The sector is maturing rapidly, with the global market projected to reach $10 billion by 2025 (UI Bakery Blog). The global data transformation market is projected to reach $10 billion by 2025. And real gains are possible when you stitch the right tools together. For example, Superblocks Blog and data transformation tools can reduce data processing time by up to 50%.
4. What operational costs should you budget for?
Expect three recurring costs, each with different drivers: compute and connector fees that scale with volume, governance overhead when lineage and audits matter, and staff time for maintenance when tools expose low-code interfaces but still demand rule review. For example, a marketing ops team that switched to a spreadsheet-first AI tool kept weekly reporting but cut manual cleanup from eight hours to two, while engineering retained dbt models for canonical tables. Plan for a short spike in coordination during handoff, then steady net savings.
5. How do you combine these five tools into a practical stack?
Design stacks by role: let spreadsheet AI handle early-stage cleansing, use Matillion or Integrate.io for ingest and scheduled ELT, push canonical tables into the warehouse and model with dbt, and reserve Talend for complex governance and hybrid deployments. This pattern keeps experimentation close to business users, preserves engineering controls in production, and prevents duplicated work as scale increases.
Numerous is an AI-powered tool that enables content marketers, ecommerce businesses, and more to perform repetitive, high-volume tasks with AI, writing SEO posts, generating hashtags, mass categorizing products with sentiment analysis and classification, and more, by simply dragging down a cell in a spreadsheet. Get started today with Numerous.ai so you can make business decisions at scale using AI in both Google Sheets and Microsoft Excel, and learn how to 10x your marketing efforts with Numerous’s ChatGPT for Spreadsheets. That practical split between messy exploration and disciplined modeling sounds tidy, but the next part exposes the critical tension you must resolve before you can truly scale.
Make Decisions At Scale Through AI With Numerous AI’s Spreadsheet AI Tool
We recommend starting with a focused pilot using Numerous, the Spreadsheet AI Tool that replaces repetitive spreadsheet chores with prompt-driven automation so your analysts can return to asking better questions. Field evidence shows that Numerous AI blogs. Over 70% of businesses report improved decision-making capabilities after integrating AI tools into their spreadsheets. Numerous AI Blogs, Numerous AI's Spreadsheet AI Tool can process data 50% faster than traditional methods, so a short trial will quickly show whether it shortens review cycles and raises the quality of your decisions.
Related Reading
How to Flip the Order of Data in Excel