
Consider that your sales dashboard, customer database, and forecasting model are all telling a different story, because each tool transforms data in its own way. Data Transformation Techniques sit at the heart of Data Operations Management, shaping how data is cleaned, integrated, and moved through pipelines so reports, models, and audits stay reliable.
How do you bring consistency across ETL, orchestration, data quality checks, metadata management, and monitoring? This guide will help you know what Data Operations Management is and why it matters for modern businesses, and give practical steps to improve governance, automation, and reporting.
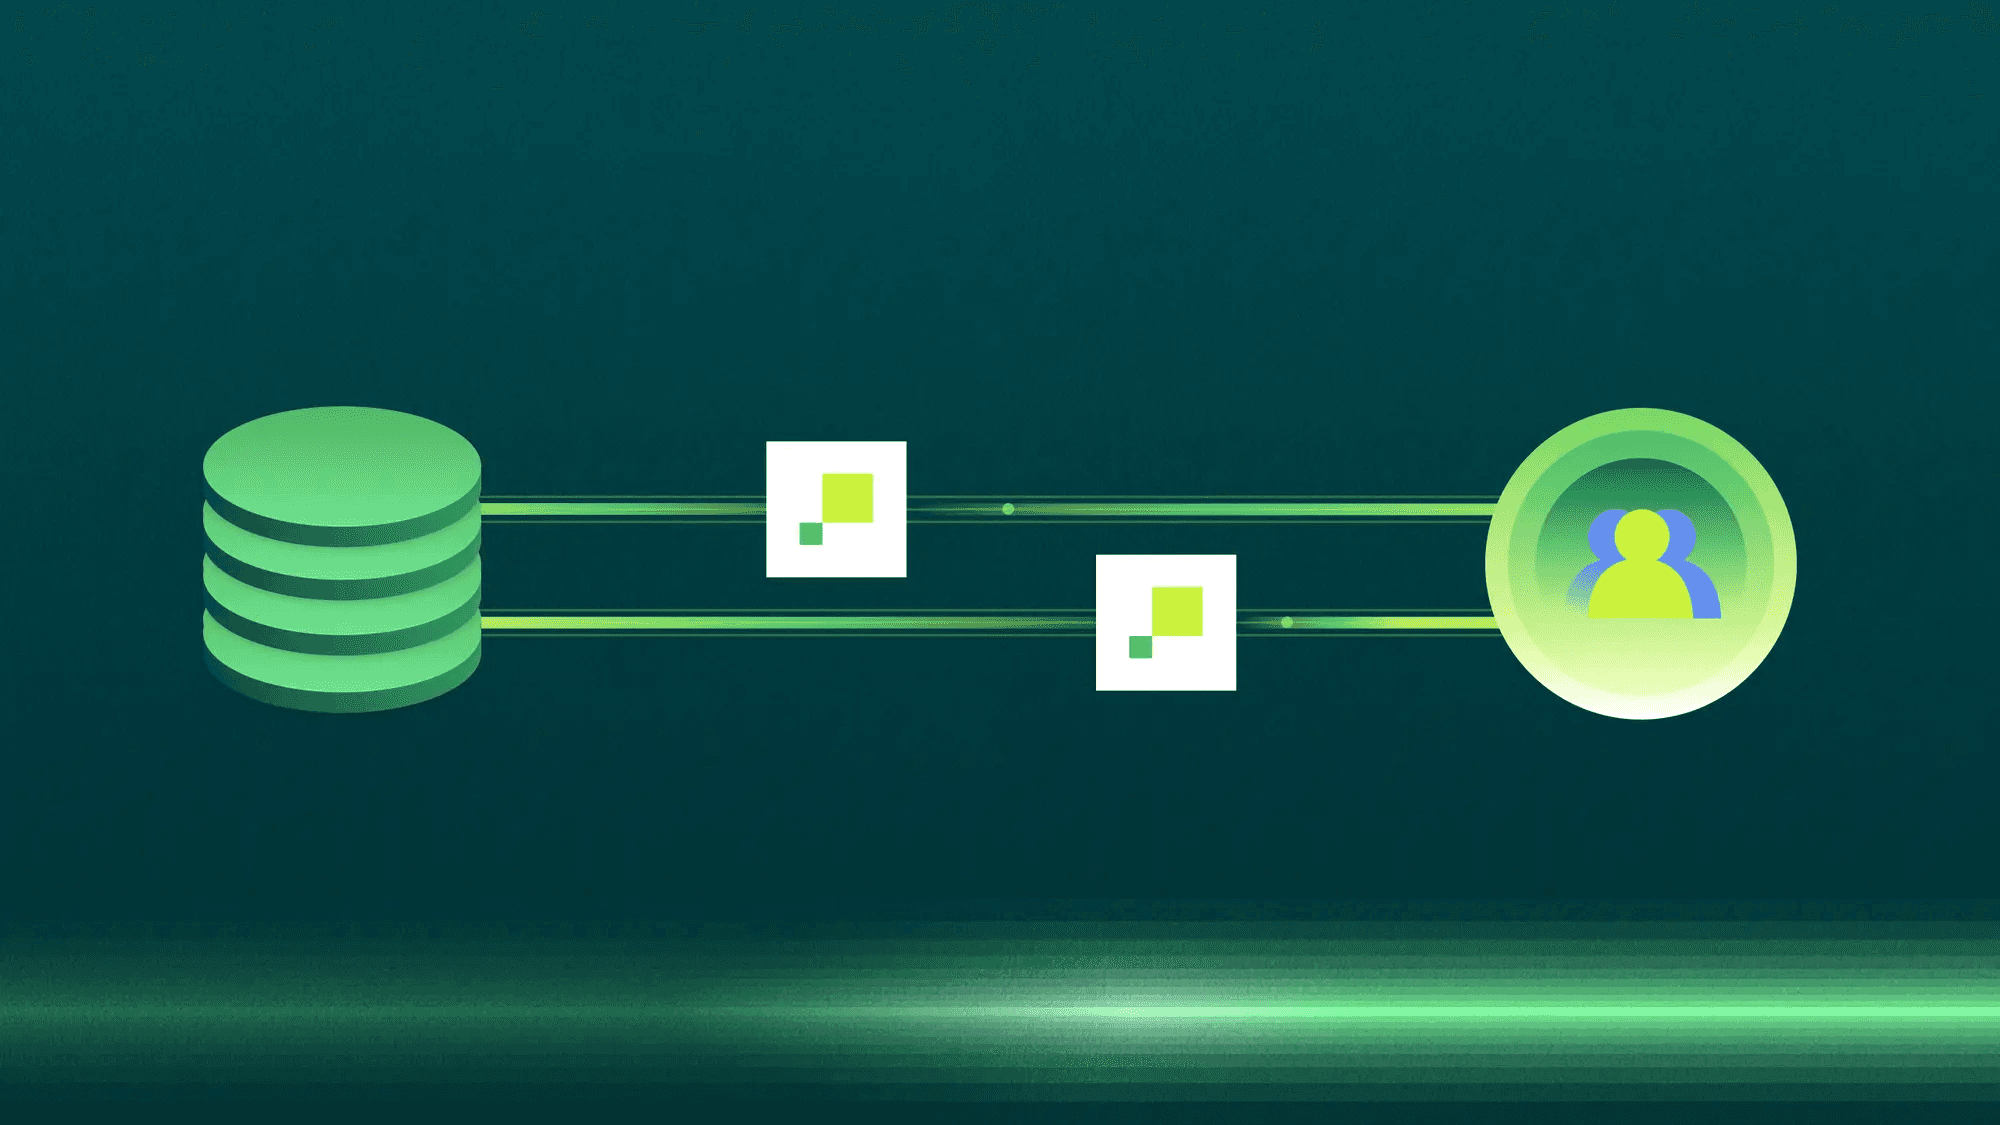
To help with that, Numerous's platform, a spreadsheet AI tool, centralizes workflows, automates transformations, and presents clear views of data quality and lineage so teams can spend less time fixing errors and more time driving value.
Table of Contents
What Is Data Operations Management (DataOps)?
Benefits of Data Operations Management for Businesses
How to Implement Data Operations Management (Step-by-Step)
Make Decisions At Scale Through AI With Numerous AI’s Spreadsheet AI Tool
Summary
Data management pain is widespread, with 89% of organizations reporting struggle, causing dashboards, customer databases, and forecasts to drift out of sync.
Treating data quality like software testing, using CI-run contracts, schema checks, and canary runs, correlates with a 30% reduction in data processing time for teams that adopt DataOps practices.Automated pipelines and continuous validation shorten the decision-making loop, and companies that utilize data analytics are 5 times more likely to make faster decisions.
Clean, consistent inputs translate to measurable productivity gains, with businesses leveraging analytics reporting a 10% increase in productivity when validation frees teams from firefighting.Clear ownership, SLOs, and versioned transformation logic improve trust and auditability, and 75% of companies reported better data quality after implementing structured DataOps.
Standardized templates, runbooks, and fewer manual handoffs reduce recurring work and errors. Over 70% of businesses report increased efficiency from AI tools in spreadsheet workflows.
Numerous AI addresses this by centralizing spreadsheet workflows, automating transformations, and surfacing lineage, approvals, and role-based access within familiar Google Sheets and Excel interfaces.
What Is Data Operations Management (DataOps)?
DataOps transforms scattered data work into a dependable, repeatable process that moves data from sources to users, incorporating checks, controls, and clear ownership, enabling teams to trust results and act swiftly. It treats pipelines, tests, governance, and collaboration as continuous engineering, rather than a series of one-off scripts or night-before reporting rituals.
Why do pipelines break as you scale?
This problem appears across product, marketing, and logistics teams: ad hoc exports and one-off scripts work for a pilot, then fail when sources multiply or schemas change. The familiar pattern is simple, time-consuming, and misleading: engineers patch connectors, analysts hand-edit CSVs, and dashboards slowly drift out of sync. The consequence is widespread operational drag, which is consistent with the finding from Meltano Blog, 89% say they struggle with data management, showing that data management pain is the rule, not the exception.
How do you keep data reliable without constant firefighting?
Treat quality like software testing. Build automated validation at ingestion, transformation, and delivery points: schema contracts, row‑level checks, sampling-based anomaly detection, and end-to-end reconciliation. Use lightweight data contracts to declare expectations, then run those contracts in CI so a breaking change fails the pipeline before it reaches users. Think of it as lifactory-quality gates, not manual inspection at the end of the line; that shift moves the work left, removes rework, and preserves trust in the outputs.
Who should own what, and how do they collaborate?
Cross-functional accountability matters more than any single tool. Engineers should own pipelines and tests, analysts should own semantic models and definitions, and product or business owners must sign off on SLAs for freshness and accuracy. Store transformation logic in version control and apply pull request reviews to changes in SQL or code, so every modification has history, tests, and approval. This reduces the endless debates over which report is right and produces a clear audit trail for compliance.
Most teams manage this the old way because it feels familiar, and that comfort buys time at first. However, as stakeholders multiply. Deadlines compress, manual handovers become fractured, approvals stall, and audit risk increases. Platforms like numerous centralized approvals, automate routing and status tracking, and provide connectors and permissions, allowing for maintaining velocity while preserving context and accountability.
What does operationalizing DataOps actually require?
Adopt CI/CD for transformations, deploy feature flags or gated releases, and significant major pipeline changes, and bake observability into every stage so you can answer questions like, Which upstream change broke downstream reports and when?' Use canary runs for new sources, automatic rollback for failed jobs, and meaningful alerts that point to remediation steps, not just error codes. Over time, that discipline lets you add sources and models without the two-week scramble every time a vendor changes an API. That shift sounds technical, but its payoff is human; fewer late-night troubleshooting sessions, clearer handoffs, and more confidence that decisions rest on the same verified data. The surprising part? What seems like a finishing move is only the start of the real work ahead.
Related Reading
Benefits of Data Operations Management for Businesses

DataOps drives growth by transforming operational data into repeatable business actions, enabling teams to learn faster and make better decisions, acting with increased confidence. That matters because speed without trust amplifies mistakes, while trust without speed leaves opportunity on the table.
1. How does DataOps shorten the decision loop?
Automated pipelines and continuous validation shrink the time between an event and a verified insight, so decision cycles become rhythm, not luck. According to Eastgate Software, "Companies that use data analytics are 5 times more likely to make faster decisions." The separation between slow and fast decision-makers is the difference between reacting to a trend and leading it. In practice, teams that remove manual handoffs reallocate hours from chasing errors to running experiments, which compounds learning across product, marketing, and operations.
2. Why does better data quality matter for output, not just accuracy?
Clean, consistent inputs change what you measure and how you measure it. When datasets are reliable, engineers can make minor alterations, safer releases, and analysts can iterate on models instead of firefighting. That shift also raises team productivity in measurable ways, as shown by Eastgate Software. Businesses that leverage data analytics see a 10% increase in productivity, which translates into more campaigns launched, more tests run, and faster product cycles. Think of quality as a significant investment in validation, a substantial amount of capacity for strategic work.
3. What typical mon pattern causes the most waste?
This pattern appears across product and marketing: early-stage workflows rely on ad hoc scripts and spreadsheet export rituals that scale poorly. Once sources multiply, hand edits proliferate, ownership becomes blurred, and inspections escalate. It becomes emotionally draining because teams feel busy and see no strategic progress, while trust in every report erodes. The failure mode is predictable: manual fixes mask the root cause until a high-stakes decision exposes the gap.
Most teams handle approvals and handoffs through email and shared files because they are familiar and require no new systems. As stakeholders multiply and decisions become time-sensitive, those threads splinter and context is lost, stretching review cycles from hours into days and burying accountability. Platforms such as Numerous provide an alternative path, letting teams configure automated syncs, role-based access, and audit trails directly from a spreadsheet interface, which compresses review cycles while preserving traceability.
4. How does DataOps change collaboration without adding meetings?
Versioned datasets and transparent lineage turn arguments over which number is right into a simple trace, so teams stop debating and start iterating. In organizations that adopt these practices, analysts and product managers shift from debating definitions to designing experiments, as the data pipeline reveals the origin of a metric and when it was last updated. Tooling that surfaces freshness and lineage in the same place where non-technical users work, such as a spreadsheet, lowers the friction of adopting these behaviors.
5. Where do the cost savings actually show up?
Savings arrive in three places: fewer hours wasted on maintenance, lower error-related losses, and reduced cloud spend through more intelligentarter scheduling. Automating route transformations and reusing templates helps avoid duplicate engineering work when new sources merge. The economic effect is not only headcount efficiency, but it is also faster time to value for every project you run, because each insight returns to the business more quickly.
6. How does this become a sustainable competitive advantage?
Speed plus trust compounds. Teams that can run short, reliable experiments accumulate validated learning faster than competitors who spend weeks reconciling numbers. That accelerates product-market fit and lets you scale tactics that work, rather than repeating costly blind bets. Consider switching from static monthly reports to continuous micro-experiments; the velocity of learning multiplies, and so does the margin for error you can tolerate. A short, concrete analogy: standard reporting is like sending weekly letters; DataOps is setting up a live newsfeed. The newsfeed is noisier, but when it is engineered with tests, lineage, and governance, it becomes a proper operational nervous system that alerts you to opportunities and risks in real-time.
The frustrating part is that this all sounds tidy until you hit ownership, testing discipline, and governance at scale — and those are the exact challenges we tackle next. Numerous is an AI-powered tool that turns spreadsheets into operational workflows, enabling marketers and ecommerce teams to automate tasks like SEO writing, hashtag generation, and mass product categorization with a sindrag-downdown. Learn how Numerous’s ChatGPT for Spreadsheets can return any spreadsheet function or complex prompt in seconds across Google Sheets and Microsoft Excel.
Related Reading
How to Implement Data Operations Management (Step-by-Step)

Treat pipelines like product features by assigning each dataset a service-level objective, a test suite, and a named owner who can be paged when issues arise. Do that, and you convert surprise firefighting into predictable maintenance and steady improvement.
How do you prove a pipeline is healthy?
Start with a small set of measurable SLOs: freshness, completeness, and an error budget tied to business impact. For example, set a freshness SLO (how often the dataset must be updated), a completeness SLO (what percent of expected rows must arrive), and an error budget that lets you decide when to roll forward or roll back a change. This pattern appears across product and marketing teams: once SLOs exist, debates about “which number is right” vanish, because you can show exactly where the contract failed.
What tests actually catch real failures?
Unit tests for individual transforms catch logic regressions; contract tests catch schema drift; sampling-based checks catch content-level anomalies. Add synthetic canary runs for significant source changes, and compare canary outputs to baseline samples before promoting the change. Think of canary runs like sending a scout into rough terrain before you send the whole caravan; they find the traps without risking the main job.
How do you scale pipeline changes safely?
Put transformations in CI, gate schema migrations behind feature flags, and automate rollback paths for failed deploys. Teams that treat pipeline changes as minor, small, and reversible releases reduce the blast radius. In fact, companies that implemented data operations management saw a 30% reduction in data processing time, a 2025 finding that shows disciplined operational practices speed throughput as well as reliability.
Most teams coordinate approvals through email and ad hoc spreadsheets because it is familiar and require no upfront work. As stakeholders multiply, threads fragment, approvals stall, and critical context disappears into inboxes, which turns a small change into an all-hands scramble. Platforms like Numeorus provide centralized routing, role-based access, and versioned datasets, allowing teams to maintain a familiar spreadsheet interface while eliminating manual handoffs and preserving an audit trail.
Which metrics indicate that the transformation was actually successful?
Track adoption and resilience together: percent of queries that use canonical datasets, mean time to detect and resolve incidents, and the rate of manual edits to production outputs. Those outcome measures matter because they tie operational changes to user behavior and cost. That aligns with Team International, which reported that 75% of companies improved data quality after implementing a structured data operations management strategy. A 2025 report shows that wing quality gains follow consistent DataOps practices.
How do you keep people calm during system changes?
Create runbooks, not blame. A two-page incident playbook that lists symptoms, immediate checks, and next-step actions helps remove panic and shorten the triage process. Pair that with a weekly 15-minute data health sync where the owner reports on SLOs and action items, and you replace anxious guessing with the predictable cadence. This quiet structure reduces the emotional cost teams feel when “the dashboard lies” at crunch time.
What operational habits prevent recurring work?
Standardize transformation templates, require small PRs for model changes, and tag releases with the dataset SLO and rollout plan so rollback is a single command. Reuse the same validation steps across sources, automate dependency discovery for downstream impact, and log every remediation for a shared knowledge base. Over time, these habits turn recurring emergencies into checklists that junior engineers can follow, freeing senior staff for higher-leverage work.
Try Numerous to remove repetitive spreadsheet work and connect your trusted workflows to automated, auditable syncs; its interface keeps analysts in control while reducing manual steps. Learn more about Numerous’s ChatGPT for Spreadsheets to see how a single prompt can return complex spreadsheet functions and everyday tasks across Google Sheets and Excel. But the most surprising bottleneck is not technology; it is the invisible social contract you never wrote down, and that is where things usually get interesting next.
Make Decisions At Scale Through AI With Numerous AI’s Spreadsheet AI Tool
Most teams accept manual spreadsheet rituals because they feel comfortable with them. That gap in awareness across content and ecommerce teams keeps talent tied to busywork instead of strategic data operations and automation. Consider Numerous, because Numerous AI Blog, over 70% of businesses have reported increased efficiency using AI tools in spreadsheets." and Numerous AI's Spreadsheet AI Tool has helped companies reduce data processing time by 50%, showing how its spreadsheet AI for Google Sheets and Microsoft Excel moves work from maintenance to fast, reliable decision-making you can scale.
Related Reading
How to Flip the Order of Data in Excel