
Picture this: your team is drowning in spreadsheets, databases, and reports, but when leadership asks for a simple insight about customer behavior or sales trends, nobody can find the answer quickly. This chaos happens because raw data, without proper organization and classification, becomes noise rather than knowledge. Using AI to categorize data has transformed how businesses tackle this challenge, turning messy information into structured assets that drive smarter decisions. In this article, you'll discover seven specific reasons why data categorization directly improves your business reporting, making it faster, more accurate, and genuinely useful for strategic planning.
Numerous's spreadsheet AI tool works directly inside your familiar spreadsheet environment, helping you automatically sort and classify data so your reports become clearer and more actionable. Whether you're grouping customer feedback, organizing product categories, or structuring financial data, this approach saves hours of manual work while ensuring consistency across your business reporting, letting you focus on what the numbers actually mean instead of how to organize them.
Table of Content
Summary
Most businesses don't lack data; they lack a system for making that data usable. Without consistent categorization, every dataset becomes a one-off project requiring manual sorting, labeling, and reorganization before anyone can extract meaningful insights. Organizations waste an average of 30% of their time searching for and preparing data, much of it spent reconciling inconsistencies before analysis can even begin, according to the Ataccama Data Trust Report 2025.
IBM estimates that poor data quality costs the U.S. economy $3.1 trillion annually, and a significant portion of that stems from the invisible friction of uncategorized information slowing down business operations. The cost isn't just the hour you spend searching for information; it's the compounding effect of that wasted hour across every team member, every reporting cycle, every decision that gets delayed because someone can't quickly find what they need.
A 2024 Gartner study found that finance teams spend 40% of their reporting time just locating and verifying data sources. That percentage drops sharply when information is organized into predefined categories from the start. The spreadsheet doesn't become simpler because you got better at Excel; it becomes simpler because the underlying structure no longer requires interpretation.
Only 15% of organizations have a comprehensive data catalog in place, meaning most teams manually reconstruct their organizational logic whenever they work with a new dataset. The repetition feels manageable in the moment, but those aren't just lost hours; they're hours that could have been spent analyzing trends, building reports, or making decisions instead of fixing mislabeled entries.
Workflow Automation Statistics 2025 shows that 73% of organizations use automation for data categorization and processing. The shift toward automated workflows reflects a broader recognition that manual categorization doesn't scale when datasets grow beyond a few dozen records, and structured processes compress time not by working faster, but by eliminating redundant decision-making at each row.
Numerous spreadsheet AI tools work directly in Google Sheets or Excel to categorize records in bulk, letting teams define categories once and apply them across entire datasets without formulas or macros.
Why Businesses Struggle Without Data Categorization Systems

Most businesses don't lack data. They lack a system for making that data usable. Without consistent categorization, every dataset becomes a one-off project requiring manual sorting, labeling, and reorganization before anyone can extract meaningful insights. The struggle isn't about collecting information; it's about the operational drag created when no repeatable structure exists to organize it.
The Real Problem Starts With Inconsistent Labels
When your team collects customer feedback, product reviews, or sales notes without predefined categories, everyone ends up inventing their own system. One person tags complaints as "issue," another uses "problem," and a third writes "customer concern." These aren't different insights; they're the same information wearing different labels.
According to the Ataccama Data Trust Report 2025, organizations waste an average of 30% of their time searching for and preparing data, much of it spent reconciling these inconsistencies before analysis can even begin.
The spreadsheet looks complete until you try to filter it. Then you discover 47 variations of what should have been five clear categories. What seemed like data entry was actually creating future cleanup work.
Context Switching Becomes the Hidden Bottleneck
Managing uncategorized data forces constant mental gear shifts. You're reviewing customer comments, then stopping to decide how to label them, then switching back to reading, then pausing again to remember which category you used three rows earlier. Each switch costs focus. Your brain has to reload context, remember the labeling logic you invented yesterday, and maintain consistency across hundreds of entries.
This isn't just inefficient. It's exhausting. Small decisions multiply across datasets until the cognitive load makes the entire task feel harder than it should be. You finish the day having "worked on data" without producing the report you actually needed.
Manual Cleanup Compounds Faster Than You Notice
Fixing one mislabeled entry takes 15 seconds. Fixing 200 takes an hour. Doing it again next week, because new data arrived, takes another hour. Over a quarter, those corrections add up to full workdays spent on tasks that feel like maintenance but function as rework. Only 15% of organizations have a comprehensive data catalog in place, meaning most teams manually reconstruct their organizational logic whenever they work with a new dataset.
The repetition feels manageable in the moment. It's only when you step back and calculate the hours that the real cost becomes visible. Those aren't just lost hours; they're hours that could have been spent analyzing trends, building reports, or making decisions.
When Categories Don't Exist, Reporting Stalls
You can't build a dashboard from chaos. Without clear categories, every report becomes a custom project requiring fresh data prep. You spend more time organizing information than interpreting it. Deadlines slip not because the data doesn't exist, but because no one can quickly pull it into a usable format.
Decisions wait on reports.
Reports wait on cleanup.
Cleanup waits on someone having time to do it manually.
Numerous's spreadsheet AI tool addresses this by letting you define categorization rules once and apply them across entire datasets inside Google Sheets or Excel. Instead of manually sorting each entry, you describe the categories you need, and the AI handles the classification in bulk. The structure stays consistent, the process becomes repeatable, and your team can move from data collection to analysis without the cleanup bottleneck in between.
Related Reading
Related Reading
Financial Data Categorization Rules Examples
Spreadsheet Data Organization Best Practices
Excel Formula To Categorize Data
Abc Inventory Classification
CSV Data Categorization Rules Examples
Use ChatGPT to Categorize Data
Excel Data Organization Best Practices
Loosely Structured Data Business Example
The Hidden Cost of Managing Data Without Categorization
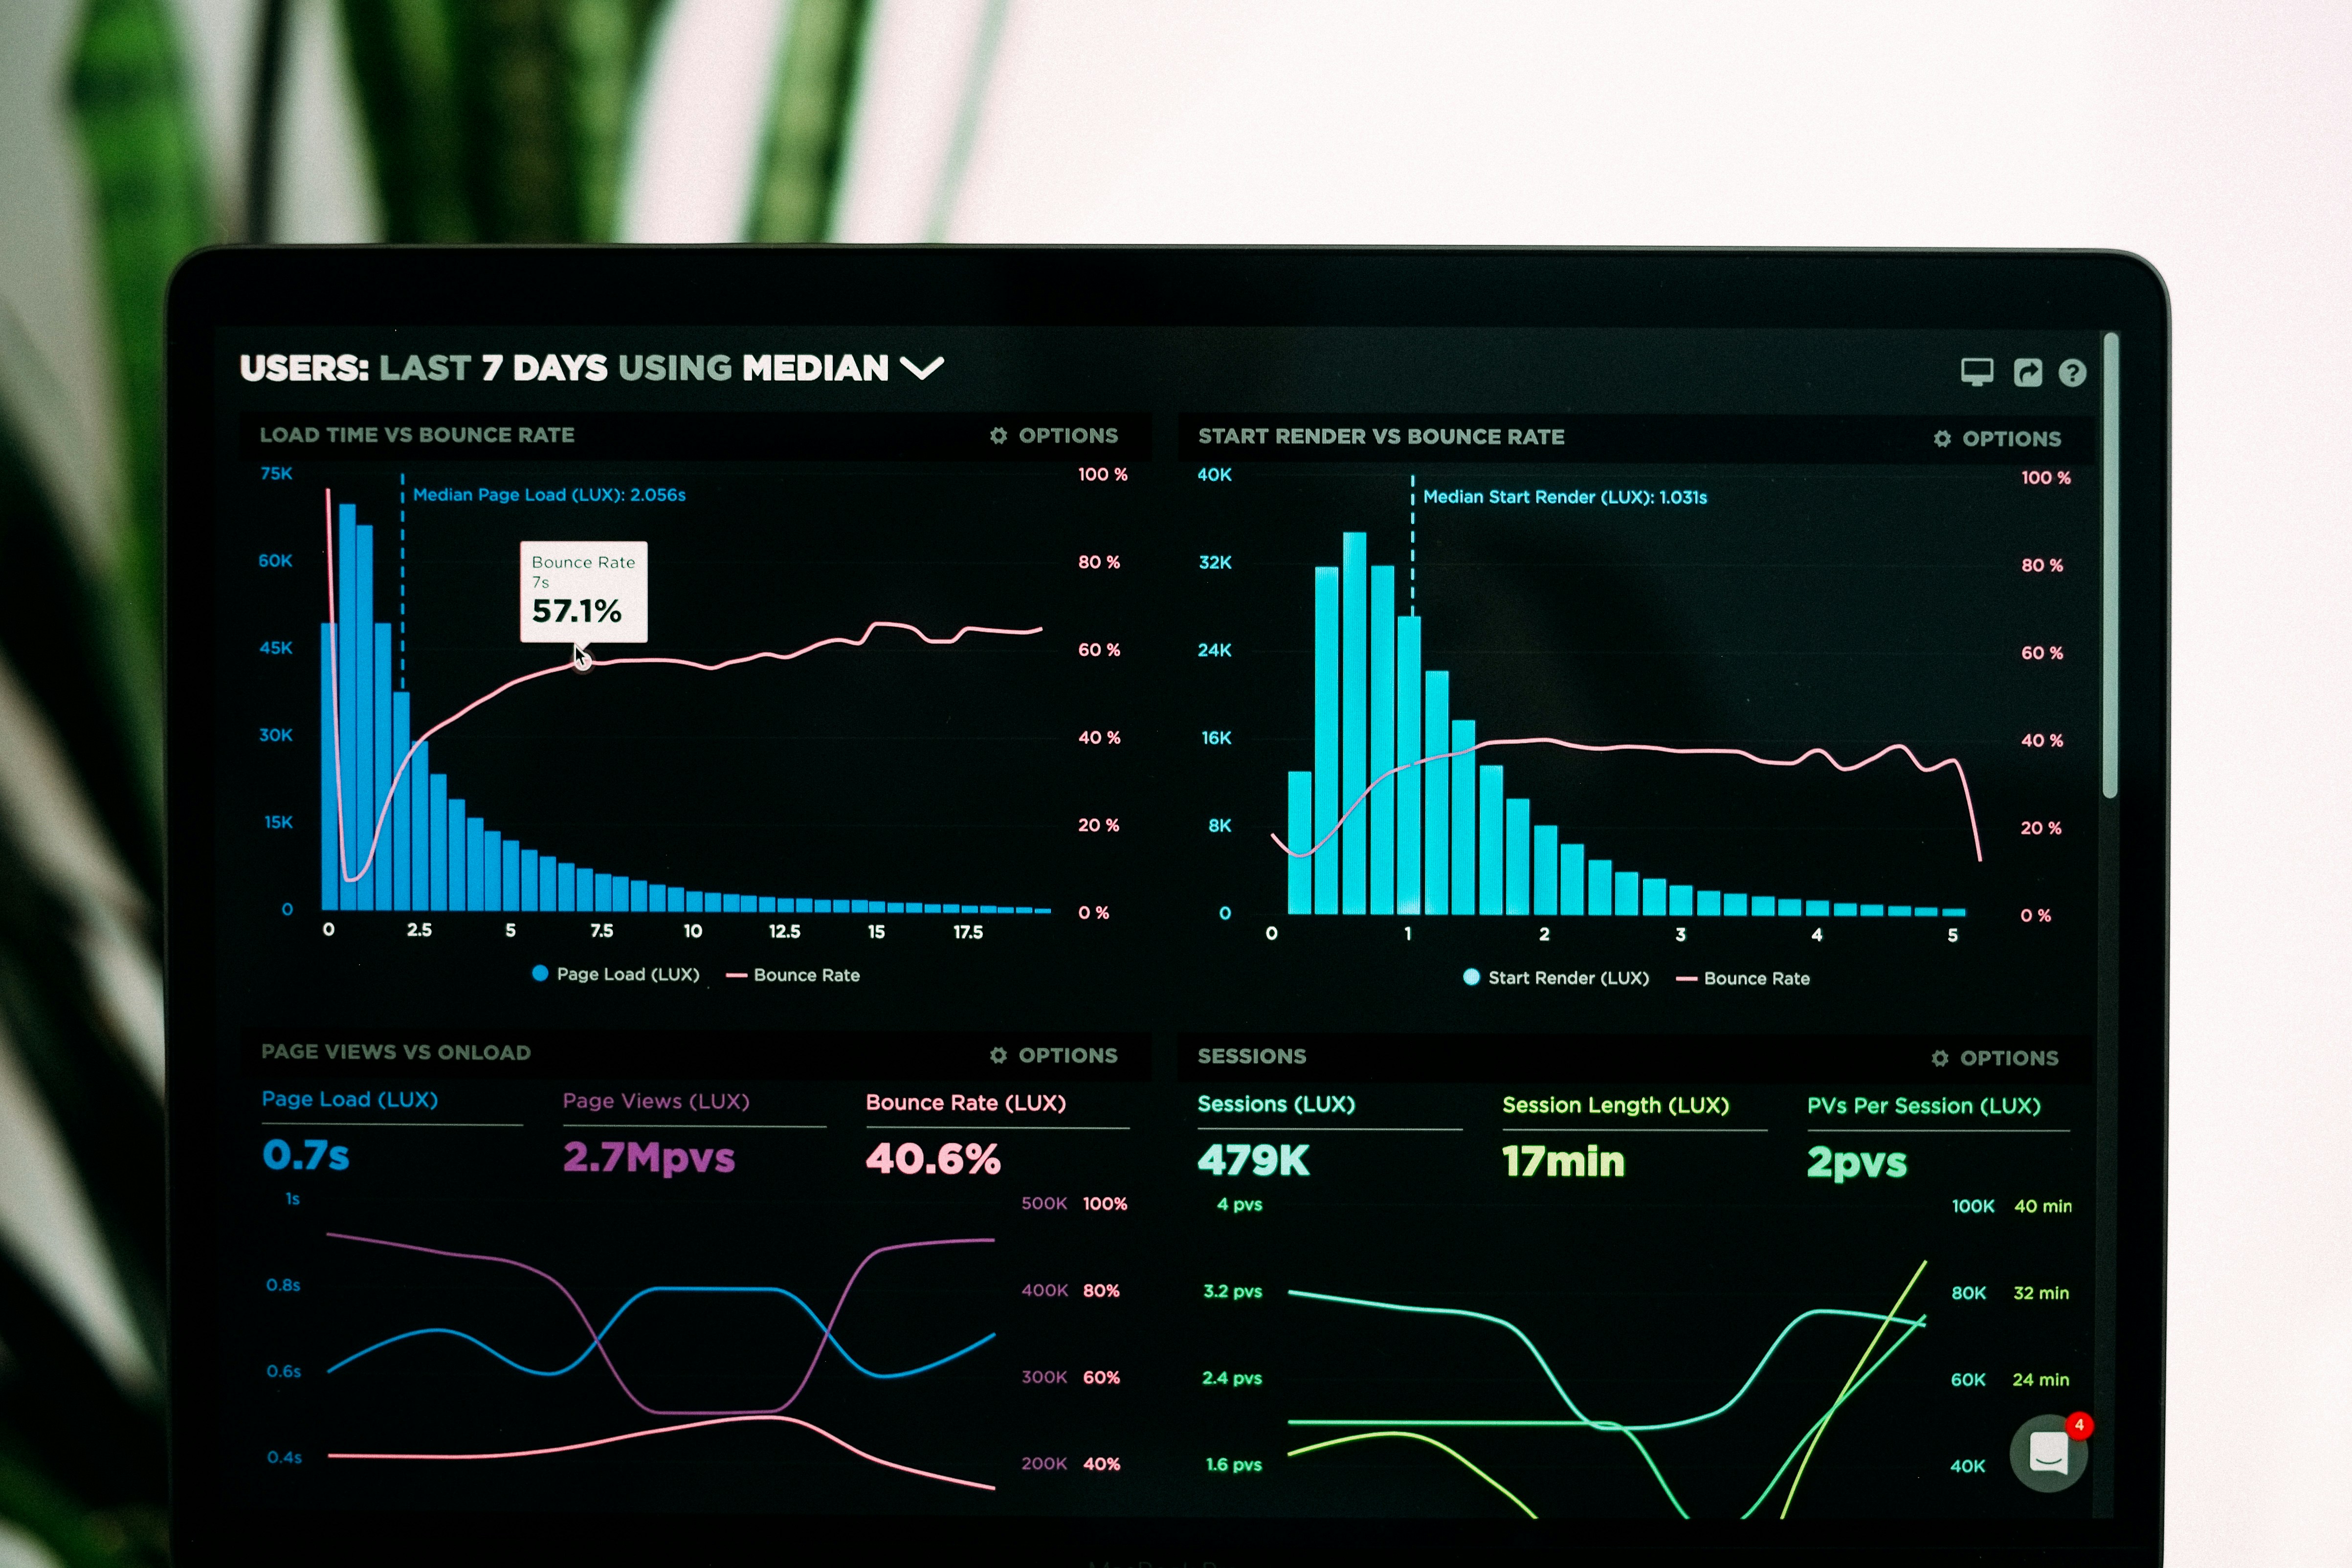
When data sits in your spreadsheets without clear categories, the cost isn't just the hour you spend searching for information. It's the compounding effect of that wasted hour across every team member, every reporting cycle, every decision that gets delayed because someone can't quickly find what they need. IBM estimates that poor data quality costs the U.S. economy $3.1 trillion annually, and a significant portion of that stems from the invisible friction of uncategorized information slowing down business operations.
The Multiplication Effect Nobody Tracks
You might think the problem is linear. One messy dataset equals one cleanup session. But uncategorized data multiplies work in ways most teams never measure.
When your sales team can't quickly segment customers by purchase behavior, they spend three extra hours preparing for quarterly reviews.
When your support team can't categorize tickets by issue type, they rebuild the same analysis every week instead of referencing historical patterns.
When your marketing team can't classify content performance, they start every campaign planning session from scratch.
The time cost isn't the initial disorganization. It's every downstream task that becomes harder because the foundation stays unstable.
When Reporting Becomes Archaeology
Every report becomes a research project when categories don't exist. You're not just pulling numbers, you're first deciding what those numbers represent, then hunting through columns to find matching examples, then second-guessing whether you caught everything. I've watched teams spend two days preparing presentations that should take two hours, not because the data is complex, but because they're simultaneously organizing and analyzing.
The cognitive load of inventing classification systems on the fly while trying to extract insights creates a kind of mental whiplash. You finish exhausted, and the next person who needs similar information starts the entire process over.
Apply Categories Across Datasets
Solutions like Numerous let teams define categories once and apply them across entire datasets inside their existing spreadsheets. Instead of each person manually sorting entries, you describe the classification system you need, and the AI handles the bulk categorization in seconds. The structure becomes consistent, the process becomes repeatable, and your team moves from data collection to insight without the archaeology phase in between.
The Decision Delay Tax
Poor categorization doesn't just slow down reporting. It delays the decisions that reporting should inform. When leadership asks which product lines are underperforming and your team needs three days to manually group sales data before they can even start the analysis, that's three days of continued investment in the wrong areas. When customer success wants to know which support issues drive the most churn, but ticket data sits in an uncategorized pile, they're making retention decisions based on gut feeling rather than patterns.
The real cost isn't the spreadsheet cleanup time. It's the business opportunities that slip away while you're still trying to organize information that should have been structured from the start. But slowed decisions and wasted hours are only part of what uncategorized data costs you.
7 Reasons Data Categorization Improves Business Reporting

Data categorization improves business reporting by transforming unstructured information into organized groups before analysis begins. Instead of cleaning, organizing, and reporting simultaneously (which creates bottlenecks), categorization separates these stages into distinct workflows. The result is faster reporting cycles, fewer errors, and clearer visibility into business patterns.
1. Categorized Data Reduces Reporting Confusion
When records arrive pre-organized into fixed categories, reporting becomes a selection task instead of a search operation. You're choosing from "expense type," "customer segment," or "sales channel" rather than hunting through thousands of unlabeled entries trying to remember which variations of "shipping cost" your team used last quarter. The difference shows up immediately in how long it takes to answer basic questions.
A 2024 Gartner study found that finance teams spend 40% of their reporting time just locating and verifying data sources. That percentage drops sharply when information is organized into predefined categories from the start. The spreadsheet doesn't become simpler because you got better at Excel. It becomes simpler because the underlying structure no longer requires interpretation.
2. Standardization Prevents Spreadsheet Inconsistencies
Most spreadsheet errors don't come from bad formulas. They come from inconsistent labeling, where "client complaint," "customer issue," and "support ticket" all mean the same thing but get counted separately. When three people on your team use different terms for identical concepts, your quarterly summary becomes unreliable before you even open the calculation tab.
Fixed category systems eliminate this drift. Instead of letting each team member invent labels, you establish standard groupings that everyone uses. The mechanism is simple: consistency at the input stage removes the need for reconciliation during reporting. When someone categorizes a transaction as "office supplies" in January, that exact label is still in place in December, and your year-end report doesn't require manual cleanup to merge five variations of the same expense type.
3. Pre-Organized Data Accelerates Analysis
Structured categories let you analyze grouped information immediately, rather than building those groups manually each time. When customer feedback arrives already sorted into "product quality," "delivery speed," and "pricing concerns," you can measure trends across thousands of responses in minutes. Without categories, you're reading individual comments one by one, trying to mentally cluster similar themes while maintaining accuracy.
The time savings compound as data volume grows. Analyzing 500 uncategorized support tickets might take an afternoon of manual review. Analyzing 5,000 categorized tickets takes the same few minutes as analyzing 500, because the grouping work is done once, not repeatedly. Solutions like Numerous handle this categorization inside Google Sheets or Excel, letting teams apply AI-driven classification to bulk data without leaving their existing workflow or learning new platforms.
4. Organization Systems Improve Calculation Reliability
Standardized categories reduce the cascading errors that happen when formulas reference inconsistent data. If your sales report pulls from a column where "Northeast," "NE," "North East," and "northeast region" all appear, your pivot table creates four separate regions instead of one. The calculation runs without errors, but the output is incorrect because the input wasn't structured properly.
Clear organization fixes this at the source. When every sales record uses the same regional categories, your formulas don't need conditional logic to catch variations. Financial summaries become more accurate not because you hired better analysts, but because the data structure no longer allows the inconsistencies that create calculation problems. Performance dashboards built on categorized data show reliable trends rather than artifacts caused by labeling drift.
5. Category Systems Scale Without Multiplying Complexity
As businesses grow, uncategorized data becomes exponentially harder to manage. Adding a second product line or regional office doesn't just double your data volume. It multiplies the possible ways that information can be labeled, stored, and misinterpreted. What worked when five people shared a spreadsheet breaks down when fifty people contribute to the same system.
Standardize Categories Early
Reusable category structures prevent this collapse. When you build standardized groupings early (customer types, transaction categories, project phases), new data fits into existing buckets rather than creating new organizational problems.
The spreadsheet that handled 1,000 records still works at 10,000 records because the underlying architecture was designed for consistency, not improvisation. Teams that establish these systems early avoid the painful mid-growth reorganization where someone has to retroactively categorize three years of inconsistent data.
6. Grouped Information Makes Patterns Visible
Business insights hide in volume until categorization reveals them. When you group 10,000 transactions by type, the top five expense categories become immediately obvious. When you sort customer feedback by theme, you see which product issues appear most frequently. The data contained these patterns all along, but they stayed invisible until the organization made them visible.
This visibility changes decision-making speed. Instead of building custom analyses each time leadership asks "which products drive the most revenue?" or "what causes customer churn?", the answer already exists in your categorized dataset. You're reading existing structure rather than creating new structure under deadline pressure. The mechanism isn't magic. It's just that pre-organized information answers questions faster than information that requires organization during the question-answering process.
7. Categorization Eliminates Repetitive Rebuilding
Most spreadsheet workflows become overloaded because users repeatedly reorganize the same data for different reports.
You build customer segments for the sales review
Rebuild them for the marketing analysis
Rebuild them again for the quarterly business review
Each rebuild introduces new opportunities for inconsistency, and each takes time without adding new insight.
Categorize Once, Report Faster
Categorize once, then reuse the structure across multiple reporting needs. When customer records include standardized segments from the start, sales pulls from the same categories that marketing uses, and finance references in revenue analysis. The workflow shifts from "search, clean, reorganize, report" to "categorize, structure, analyze, report." The second version removes the bottleneck that makes reporting feel like starting from scratch every time.
Better business reporting doesn't require collecting more data or hiring more analysts. It comes from organizing existing data into structured systems before reporting begins. The improvement shows up as reduced cleanup time, faster analysis cycles, and fewer calculation errors due to inconsistent labeling. When information arrives pre-categorized, reporting becomes a selection task instead of an organizational challenge.
Related Reading
Appraisal Data Categorization
Excel Categorize Data By Range
Categorize Esg Data
Automated Expense Categorization Methods
Data Categorization Methods
How To Categorize Data Based On Values In Excel
Automate Financial Data Categorization
How To Categorize Data In Google Sheets
Effective Methods For Categorizing Spend Data
The 30-Minute Workflow to Categorize Business Data Faster

The 30-minute workflow separates categorization into distinct stages instead of mixing organization with analysis. You define categories first, clean the dataset second, apply labels third, build summaries fourth, verify critical records fifth, and save the structure last. That separation prevents the back-and-forth cleanup that stretches two-hour tasks into two-day projects.
According to Workflow Automation Statistics 2025, 73% of organizations use automation for data categorization and processing. The shift toward automated workflows reflects a broader recognition that manual categorization doesn't scale when datasets grow beyond a few dozen records. Structured processes compress time not by working faster, but by eliminating redundant decision-making at each row.
Minute 0–5: Define the Categorization Goal First
Before opening the spreadsheet, decide what grouping structure serves the business question you're answering. Ask:
What should this data be grouped by?
What insights matter most?
What decisions will this reporting support?
Examples include expense categories for budget tracking, customer segments for retention analysis, sales channels for performance comparison, department performance for resource allocation, or transaction types for fraud detection. The specificity of your categories determines how useful the final report becomes.
Prevent Label Inconsistencies
Undefined organization systems create unnecessary spreadsheet work. When categories emerge organically during data entry, different team members invent overlapping labels. One person tags expenses as "travel," another uses "business travel," and a third chooses "transportation." The reporting stage then requires reconciling these variations before any analysis begins.
And unnecessary spreadsheet work creates operational overload. I've watched teams spend 20 minutes categorizing data, then 40 minutes fixing inconsistencies they created during those first 20 minutes. The fix takes longer than the original task because it requires pattern recognition across hundreds of cells instead of applying a predefined rule.
Minutes 5–10: Clean and Structure the Dataset First
Before categorizing records:
Remove duplicates
Fix inconsistent labels
Standardize column headers
Organize raw entries
This stage addresses data quality issues that would otherwise compound during categorization.
Remove Duplicates and Standardize Labels
Duplicates distort category counts. If "Client A - Invoice 1001" appears three times due to import errors, your expense summary will overstate that client's spending by 200%. Fixing this after categorization requires recalculating summaries, doubling the verification workload.
Inconsistent labels create categorization friction. If your dataset contains "N/A," "n/a," "Not Available," and blank cells all representing missing data, you'll waste cognitive energy deciding whether these require different category assignments or identical treatment. Standardizing them to a single null indicator before categorization eliminates that decision fatigue.
Clean Data Before Categorizing
Tools like Numerous handle bulk cleaning operations inside spreadsheets without requiring data exports or API configurations. Teams use prompts like "Clean this business dataset" or "Standardize these spreadsheet labels" to process hundreds of rows in seconds, converting cleanup from a manual cell-by-cell task into a single instruction.
Structured data before categorization reduces spreadsheet friction. When column names follow consistent patterns and values use uniform formatting, categorization rules apply cleanly without requiring constant adjustments for edge cases.
Minutes 10–15: Categorize Records Before Building Reports
Now focus exclusively on:
Grouping records
Assigning categories
Organizing datasets
Structuring labels
This stage applies your predefined categorization system to each row without attempting to analyze patterns or build visualizations.
Separate Categorization From Analysis
Do not build dashboards immediately.
Do not review analytics yet.
Do not manually reorganize categories repeatedly based on emerging patterns.
Those activities belong to later stages, and mixing them with categorization creates the context-switching overhead that stretches timelines.
Turn Categorization Into Pattern Matching
The cause-and-effect relationship is direct. Repeated spreadsheet cleanup during categorization slows workflows because each interruption requires reloading context about where you stopped and what rule you were applying. Structured categorization that follows a predetermined system maintains momentum because each decision follows the same logic.
When categories are defined upfront, and data is cleaned beforehand, categorization becomes pattern matching rather than creative problem-solving. You're not inventing labels as you go. You're applying existing rules to prepared data, which transforms a cognitively demanding task into a systematic one.
Minutes 15–20: Build Categorized Reporting Summaries
Convert grouped data into:
Summary tables
Category reports
Performance breakdowns
Dataset overviews
Business reporting sections
This stage translates categorized records into formats that support decision-making.
Data categorization is designed for visibility, not raw spreadsheet complexity. A finance director doesn't need to see 800 individual expense transactions. They need to see spending by category, department, and month. The categorization work you completed in the previous stage makes these summaries possible without additional data manipulation.
Make Reports Easier to Interpret
Clear summaries improve business decision-making. When categories align with how stakeholders think about the business (by product line, customer segment, or geographic region), reports answer questions directly instead of requiring interpretation. The gap between "here's the data" and "here's what it means" collapses.
I've seen quarterly reviews that used to take three hours compressed to 45 minutes once categorized data replaced raw transaction dumps. The meeting time didn't shrink because people talked faster. It shrank because participants spent less time asking "what does this row represent?" and more time discussing "should we adjust our approach based on these patterns?"
Minutes 20–25: Verify Critical Categories and Records
Do not recheck the entire spreadsheet.
Only verify important labels
High-value records
Grouped summaries
Critical reporting outputs
Selective verification prevents unnecessary spreadsheet rework while catching errors that materially affect business decisions.
Verify High-Value Records First
The Pareto principle applies to categorization accuracy. Roughly 20% of your records typically represent 80% of the business value:
The largest transactions
The most important clients
The highest-risk activities
Verifying those records thoroughly while spot-checking the remainder balances quality control with time efficiency.
Catch Errors Before Reporting
High-value records warrant extra scrutiny because miscategorization can lead to disproportionate reporting errors. If you incorrectly categorize a $50,000 contract as "office supplies" instead of "professional services," your departmental budget analysis will show a massive supply overspend and an unexplained services underspend. That single error could trigger unnecessary vendor renegotiations or budget reallocation discussions.
Verification at this stage catches systematic errors before they propagate into reports and presentations. If you notice that all records from a specific data source landed in the wrong category, you can correct the pattern once rather than fixing individual instances after stakeholders have already seen incorrect summaries.
Minutes 25–30: Save the Categorization System
Save the category structure
The spreadsheet workflow
The grouping logic
The reporting layout
Documentation transforms a one-time success into a repeatable system.
That way, the next dataset becomes faster to organize and report. When monthly expense reports use identical category structures, you're not reinventing the organizational system each month. You're applying a proven template that already aligns with how your finance team thinks and how your reporting tools expect data to be formatted.
Document Categories for Reuse
The goal is not one fast categorization session. It is a repeatable reporting speed. Teams that save their categorization systems report that subsequent datasets take 60-70% less time to process because the decision-making framework already exists.
I've watched teams struggle with this repeatedly. They built an excellent categorization system for Q1 reporting, then started from scratch in Q2 because they didn't document their approach. By Q3, they're using different category names for the same concepts, which breaks year-over-year comparisons and forces reconciliation work during annual reviews.
Before vs After Snapshot
Before structured workflows: Teams experienced manual spreadsheet cleanup, where each dataset required custom organizational decisions. They rebuild category structures repeatedly because no standard exists, resulting in overloaded reporting workflows in which analysis and organization occur simultaneously. Business analysis slows because data preparation consumes time that should be spent on generating insights.
After implementing 30-minute categorization workflows: Teams work with structured categorization systems that apply consistently across datasets. They maintain clean, grouped datasets where records follow predefined organizational logic. Reporting workflows accelerate because summaries are built from pre-categorized data rather than requiring real-time organization. Organizational systems become repeatable because documentation preserves the logic for future use.
Separate Workflow Stages for Faster Reporting
The time reduction does not come from rushing through spreadsheets. It comes from reducing overlap inside the business reporting workflow. When cleaning, categorizing, analyzing, and reporting happen as distinct stages rather than intermingled activities, each stage completes faster because it focuses on a single objective without constant context switching.
But knowing the workflow structure is different from having the right tools to execute it efficiently.
Categorize Business Data Faster With Numerous
The workflow structure matters less if you spend three hours executing it manually every reporting cycle. You need a system that applies the categorization logic without having to rebuild it from scratch each time. That's where tools built for spreadsheet-based AI operations change the equation.
Most teams organize business data by opening Excel, scanning columns, writing formulas, and manually assigning labels across hundreds or thousands of rows. It works, but it doesn't scale. When your dataset refreshes weekly or monthly, you're back at the start, reapplying the same categorization rules you perfected last cycle. The work compounds instead of disappearing.
Categorize Data Inside Spreadsheets
Solutions like Numerous let you prompt ChatGPT directly inside Google Sheets or Excel to categorize records in bulk. You describe the categories once, apply them across your dataset, and the AI handles label assignment without formulas or macros. When new data arrives, you rerun the prompt instead of rebuilding the workflow. The structure persists, and categorization occurs within minutes rather than hours.
You don't need API keys, Python scripts, or separate platforms. The categorization happens where your data already lives. If your team shares spreadsheets for budget tracking, customer segmentation, or campaign analysis, they can access the same AI-powered workflow without exporting files or learning new software. The spreadsheet serves as both the collaboration layer and the execution environment.
Turn Categorization Into a Prompt
Open your dataset, write a categorization prompt that defines your groups, and let the AI assign labels across every row. Review the output, adjust categories if needed, and save the structure for the next reporting cycle. You've just converted a three-hour manual task into a 30-minute workflow that repeats without degrading.
Fast reporting isn't about working harder inside spreadsheets. It's about removing the repetitive organizational tasks that consume time before analysis even starts. When categorization becomes a prompt instead of a project, you spend less time preparing data and more time using it.