
Quantifying variation in data is crucial for making informed decisions, whether analyzing sales figures or evaluating test scores. Standard deviation calculations—using functions such as STDEV, STDEV.S, or STDEV.P—provide clear insight into data dispersion. How to Use Apps Script in Google Sheets to automate these calculations efficiently and reduce manual work?
Automated techniques simplify recurring tasks by applying both built-in formulas and custom functions across multiple sheets. Approaches range from simple STDEV formulas to filtered calculations over specific ranges, making it easier to interpret product variances or other metrics. Ultimately, Numerous's Spreadsheet AI Tool streamlines formula generation and range setup, enabling users to complete data analysis more efficiently.
Summary
Standard deviation measures how tightly numbers cluster around the mean. In roughly standard datasets, about 68% of data fall within one standard deviation, so a low spread indicates the average is more likely to represent typical outcomes.
Values beyond two standard deviations are uncommon and warrant investigation, since roughly 95% of observations lie within two standard deviations, making those outliers important to flag.
Picking the correct function changes the interpretation. Use STDEV.S for samples and STDEV.P for populations. For example, =STDEV.S(A2:A10) computes the sample standard deviation for the A2:A10 range.
Nonnumeric or hidden junk is a frequent cause of errors, and standard deviation needs at least 2 numeric values, so guard formulas with COUNT checks like IF(COUNT(range)<2, "Need 2+ numbers",...) to avoid #DIV/0! and misleading results.
Filters affect calculations because Sheets processes only the visible rows. Use visibility-aware patterns, such as SUBTOTAL(103, OFFSET(...)) inside FILTER, or run three quick audit checks (numeric COUNT, non-numeric count, filter active) to validate results.
Small efficiency gains compound at scale: over 2 million users rely on Google Sheets for analysis, and compressing prep from hours to minutes reduces repeated cleanup and reporting overhead.
'Spreadsheet AI Tool' addresses this by generating formulas, parsing ranges, and suggesting whether to use sample or population standard deviation, reducing manual setup and ambiguity.
Table of Content
5 Common Errors You Can Encounter When Calculating Standard Deviation in Google Sheets
Make Decisions At Scale Through AI With Numerous AI’s Spreadsheet AI Tool
What Is Standard Deviation?

Standard deviation measures how closely your numbers group around the average. You use it to determine whether that average accurately reflects your data or masks essential differences. It shows whether results are steady, whether there is risk, and whether a noticeable trend is reliable.
Why does spread matter more than just one average?
This issue arises in student projects and business reports, where teams often assume the mean tells the whole story.
They might make choices that go wrong when the differences become clear. When averages look the same, but the spreads differ, decisions can change a lot. What appears equal can mask significant inconsistencies, and an unusual number can alter the overall conclusions.
How do practitioners read standard deviation in context?
In standard datasets, about 68% of the data falls within one standard deviation of the mean, according to Investopedia. This means that most observations will be close to the mean, and slight differences are usually normal.
For context, about 95% of the data falls within two standard deviations of the mean. According to Wikipedia, values outside this range should be treated as potential anomalies rather than normal variations.
What does that look like in everyday work?
Think of the mean as a stage and the standard deviation as the distance the crowd spreads into the audience. A tight circle shows repeatable outcomes you can trust, while a wide circle shows variability that needs planning.
For example, inventory buffers, risk limits, and experimental sample sizes may need to be adjusted due to that spread. This mental picture helps turn a number into actionable choices, and leveraging our Spreadsheet AI Tool can make those calculations more efficient.
When should you check the standard deviation?
Most teams manage changes manually, using cleanup and notes, because the Sheets functions are easy to use. This method works well at the beginning, but as messy inputs grow and stakeholders require explanations, prep time increases significantly, and mistakes can occur. Teams discover that solutions like Numerous.ai help them clean up messy inputs automatically, generate plain-language explanations with AI, and produce many examples without managing API keys. This reduces preparation time from hours to minutes, avoids duplicate queries, and keeps results ready for teamwork.
When should you check standard deviation, beyond the obvious?
Use it whenever you need to decide whether an average is actionable: comparing groups, setting control limits, or determining how much buffer to maintain for demand spikes. In experiments, standard deviation helps you see if your sample size is big enough; in finance, it shows the volatility you need to protect against. The metric becomes a tool for making decisions, not just a number to report.
What is a quick rule of thumb for standard deviation?
Here is a quick rule of thumb: treat the standard deviation as a measure of reliability for the mean. Low deviation indicates you can trust the average and take action; high deviation suggests you need to review the details, clean the data, or use stronger methods before allocating resources.
This simple trust test is just the beginning. The following steps will show you how to turn these insights into specific actions in Google Sheets. Using our Spreadsheet AI Tool can significantly enhance your data analysis.
Related Reading
How to Calculate Standard Deviation in Google Sheets

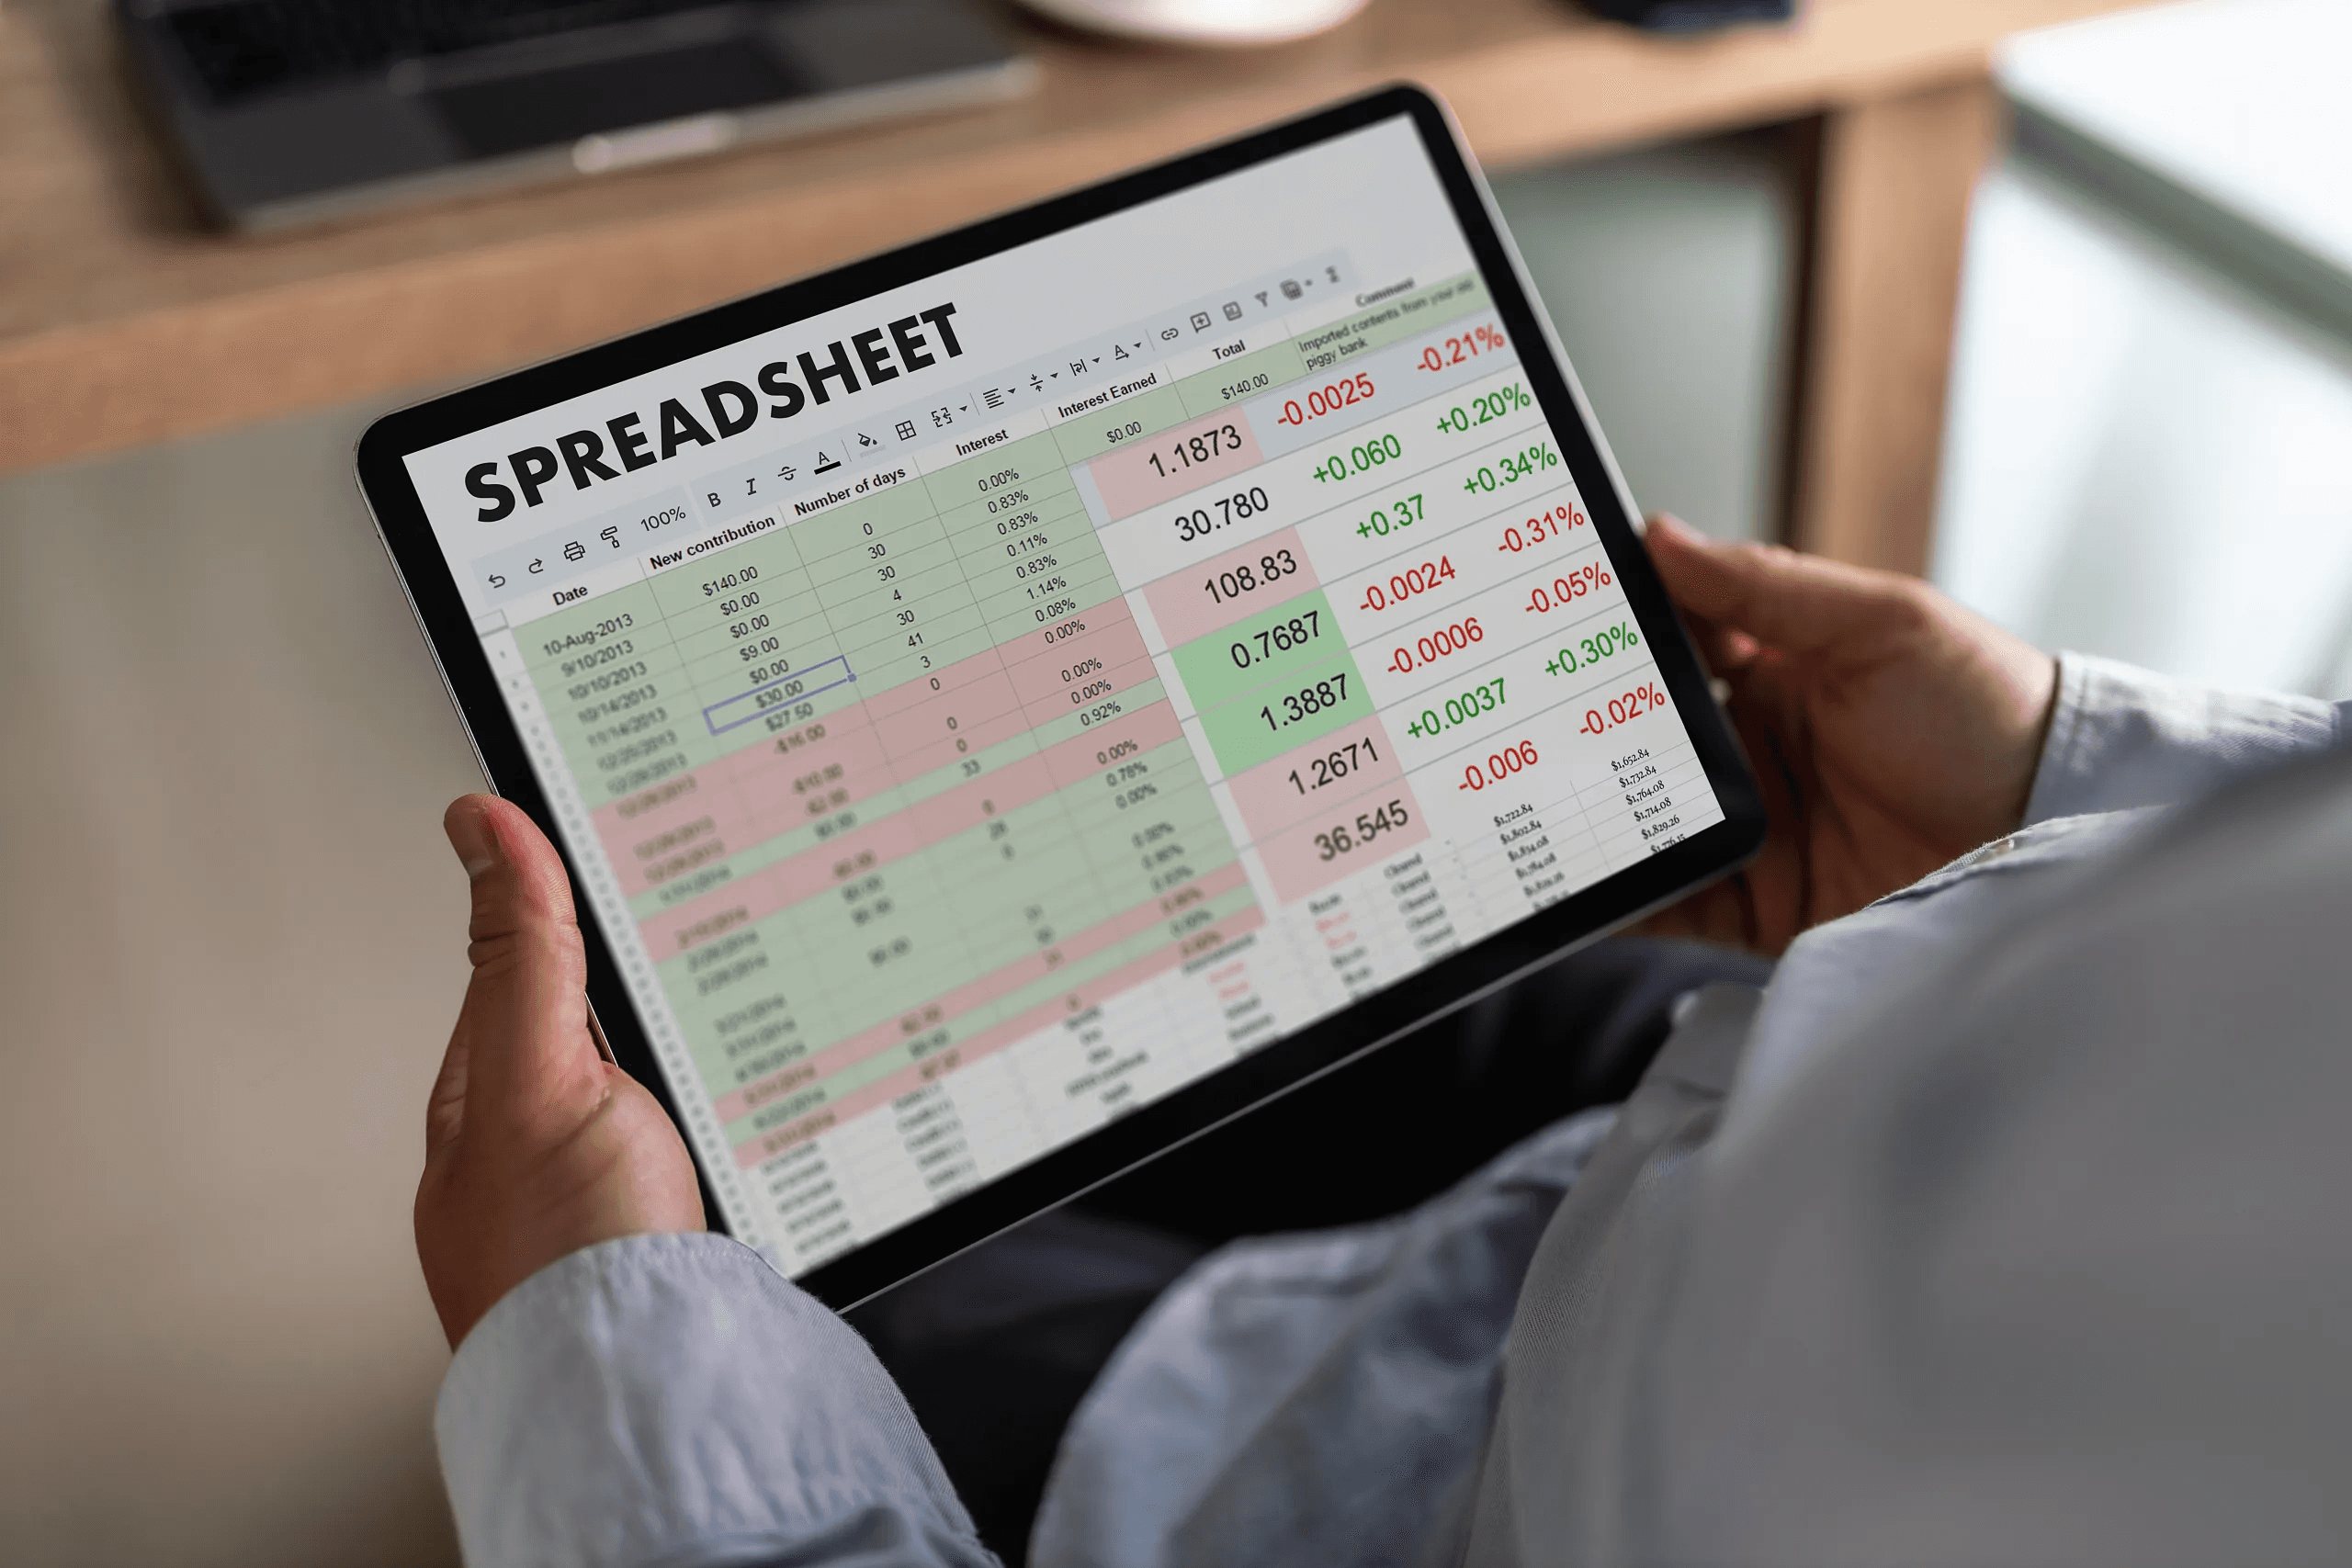
Google Sheets has everything you need to quickly compute standard deviation, whether in a cell or across columns. Just choose the proper STDEV function, point it at your range, and the sheet will update automatically as values change. For more complex tasks, such as quick filtering, multi-range selection, or custom behaviors, a simple Apps Script function can enhance Google Sheets without changing your workflow.
Which STDEV function should you pick?
Use STDEV.S when your data is a sample and STDEV.P when you have the whole population.
You should use the old STDEV only for older files that require backward compatibility. For example, STDEV.S(A2:A10) calculates the sample standard deviation, while STDEV.P(A2:A10) finds the population value.
How do I enter the formula so it updates reliably?
To ensure the formula updates correctly, enter your numbers in a single column or a contiguous block. Click the result cell and type the function with the correct range. Sheets recalculates live, so any changes made in the referenced range will update the result right away.
If you like one-liners that mix ranges, you can use multiple arguments. For example, use =STDEV.S(A2:A10, C2:C10) to treat both ranges as a single sample.
Can I calculate across many columns or ignore non-numeric cells?
Yes, STDEV functions can take multiple ranges and will automatically ignore blank or text cells. You can use the formula =STDEV.S(A2:A50, B2:B50) for this. If you want to combine columns into a single vector in the formula, put the ranges in array notation like this: =STDEV.S({A2:A50; B2:B50}) to stack them on top of each other.
What about filters and hidden rows?
When analyzing a filtered view, Sheets will calculate using only the visible values. This means hidden rows do not affect the results, making quick segmented analysis simple without additional formulas. This feature lets you easily compare categories or months after applying a filter, without changing your data.
When does a little script give you more control?
When a small script provides greater control, it can significantly enhance functionality. If you want a custom function that removes non-numeric noise, handles errors reliably, or straightforwardly applies sample versus population logic, you can add a short Apps Script. For instance, this custom function calculates the sample standard deviation for a one-dimensional range while ignoring non-numeric:
function STDEV_JS(range) {
var vals = range.flat ? range.flat() : range.reduce(function(a,b){return a.concat(b);},[]);
var nums = vals.filter(function(v){return typeof v === 'number' && !isNaN(v);});
if (nums.length < 2) return null;
var mean = nums.reduce(function(s,x){return s + x;},0) / nums.length;
var sq = nums.reduce(function(s,x){var d = x - mean; return s + d*d;},0);
return Math.sqrt(sq / (nums.length - 1));
}
How to use the custom function?
Save this as a bound script; then call =STDEV_JS(A2:A100) from the sheet. To compute the population standard deviation, you can add a parameter or a second function to achieve STDEV.P behavior.
What patterns have emerged with cohort comparisons?
A practical pattern emerges in cohort comparisons when processing season-to-season rank datasets for three competitive titles over six months. It became clear that players struggled to differentiate real improvement from shifts in distribution.
They expressed a need for a consistent, repeatable metric to compare across resets. This is why combining standard deviation with percentile or normalized scores is a common practice in longer-term analysis.
What hidden costs arise from manual data handling?
Most teams handle data manually, which creates hidden costs. They usually do pre-analysis cleanup and explanations as separate steps. This method feels familiar and is easy for small tasks. However, as datasets get bigger, manual cleanup efforts increase.
As a result, duplicate queries waste time and lead teams to re-explain to stakeholders. They realize that solutions like Numerous.ai can automate the cleaning of messy inputs. This tool creates plain-language formula explanations using =AI and produces bulk examples without needing API keys, long-term re-queries, or complex scripting. As a result, tasks that used to take hours can now be completed in minutes while keeping results shareable across the team.
What is the context of adoption and function documentation?
Context on adoption and function documentation. According to Google Docs Editors Help, the STDEV function calculates the standard deviation from a sample, so STDEV.S is the recommended choice for sampled data.
Additionally, the SheetAI Blog reports that over 2 million users utilize Google Sheets for data analysis. This large user base underscores how minor improvements in formulas and scripts can deliver meaningful time savings.
Can you provide ready-to-use Apps Script utilities?
I can provide several ready-to-use Apps Script tools that detect and ignore outliers, calculate both sample and population standard deviations (SDs), and offer a one-cell explanation of the result for stakeholders.
What is the subtle mistake to avoid?
That simple workflow works until you find a small mistake that no one notices. At that moment, everything may start to look wrong.
5 Common Errors You Can Encounter When Calculating Standard Deviation in Google Sheets
Fixing these five errors needs specific checks, a few simple formulas, and a couple of easy scripts. This will ensure your sheet displays problems rather than hides them.
Below, practical diagnostics, exact formulas you can paste in, and a small Apps Script helper will make results predictable and explainable. For those looking to enhance their data handling, our Spreadsheet AI Tool simplifies complex calculations and ensures accuracy.
Did I pick the wrong standard deviation function?
- Quick check, then a safe change. Compare the two results side by side: in one cell, put STDEV.S(range) and in the next, put STDEV.P(range). If the numbers are very different, check how many values you actually have with COUNT(range) and whether you meant to take a sample. Remember that when you use cloud analytics, “STDEV for BigQuery calculates the sample standard deviation of a data column.”
- Automated rule, no guessing. Put a small helper cell where you say if the dataset is a full population or a sample, then use a formula that picks the proper function automatically:
=IF(helper="population", STDEV.P(A2:A100), STDEV.S(A2:A100))
This makes the choice clear and visible to others, so you avoid the small change that ruins a report.
Why am I getting "VALUE!" or numbers that look incorrect?
Find hidden junk and convert consistently. Nonprinting characters, currency symbols, and pasted text from web tables are common problems. This pattern occurs in monthly marketing reports and inventory reconciliations, where imported rows contain stray characters that convert numbers to text, wasting hours fixing issues.
Use FILTER with ISNUMBER to make the formula only look at real numbers:
=STDEV.S(FILTER(A2:A100, ISNUMBER(A2:A100)))
If you want to change strings that look like numbers, wrap VALUE and TRIM in ARRAYFORMULA and IFERROR, but only after checking a sample, so you do not inadvertently convert insufficient data. Also, keep this quick check cell: =SUMPRODUCT(NOT(ISNUMBER(A2:A100))) to count non-numeric items and show the team how many bad cells remain.
Did I select the wrong cell range?
Test it, then lock it down. Missed rows, stray totals, or header text can be a hidden source of incorrect answers.
Confirm your selection by using `COUNT(range)` and compare it to the expected row count. If they don't match, highlight the problem rows using conditional formatting to flag non-numeric cells or duplicates.
Several strategies can improve the reliability of your ranges: Make ranges clear by naming them or using a dynamic filter that ignores blanks and text: `=STDEV.S(FILTER(namedRange, namedRange<>"", ISNUMBER(namedRange)))`. This method ensures that adding a new row doesn’t need manual formula changes. Reviewers can view the named range definition rather than searching for offsets.
Why does my sheet show DIV/0!?
Make the minimum requirement obvious. Standard deviation needs at least two numeric values. So, wrap calculations with a guard that tells you why it failed: =IF(COUNT(A2:A100)<2, "Need 2+ numbers", STDEV.S(FILTER(A2:A100, ISNUMBER(A2:A100))))
This is much better than a confusing error. It makes failures clear and helps expedite fixes during busy reporting periods. Our Spreadsheet AI Tool can also help identify and resolve calculation errors.
Why do results change after I apply a filter?
Results may change after applying a filter because the filter applies to visible rows. Filters hide some rows, and Google Sheets only calculates STDEV for visible cells. This can be helpful, but it can also be surprising. To make a formula that only uses visible cells, use the SUBTOTAL function to check visibility within FILTER: =STDEV.S(FILTER(A2:A100, SUBTOTAL(103, OFFSET(A2, ROW(A2:A100)-ROW(A2), 0))))
This FILTER will keep only the rows that are visible after applying the filter. If you want to ensure calculations include all rows, regardless of the filters, consider calculating against a cleaned, cached range in a helper sheet so the filters do not affect the source.
How can I diagnose errors with Apps Script?
A compact Apps Script helper can help diagnose and fix errors. Using a small custom function, it can return an explanatory result rather than a blank error.
To implement this, paste the function into Extensions > Apps Script, save the script, and then call =DIAG_STDEV(A2:A100, "sample") from a cell. If you're looking for more powerful assistance, consider how our Spreadsheet AI Tool enhances productivity in managing your data.
What does the Apps Script function do?
The function `DIAG_STDEV(range, mode)` calculates the standard deviation of a range of numbers. It starts by flattening the range to make sure all values are easy to reach. The function filters the numbers to retain only valid numeric values, excluding any non-numeric entries. If there are fewer than 2 numeric values, the function returns an error message: "ERROR: need at least 2 numeric values."
Next, the mean is calculated by summing all values and dividing by the count. After that, it calculates the squared differences from the mean. Finally, the standard deviation is determined based on whether the mode is set to 'population' or not, which decides the divisor. This results in a high standard deviation.
Key points: This function provides a clear error message, ignores non-numeric values, and allows the user to choose between population and sample logic. This design eliminates guesswork and accelerates processes, especially when time is tight.
What is the hidden cost of manual spreadsheet fixes?
Most teams patch spreadsheets manually because it is familiar and quick. While this might work for a small amount of data, as a file grows with more external imports, filters, and fast edits, the manual method leads to repeated work, messy cleanup rules, and slow reports.
Key points include
Repeated cycles of cleaning and rerunning formulas.
A new import is breaking the sheet again, resulting in additional hours spent and reduced confidence.
Solutions like Numerous automate the cleanup step, apply consistent rules at scale, and provide easy-to-understand explanations and bulk examples. This approach helps teams stop putting out the same fires each month. Also, platforms with built-in caching and no additional API keys can shorten setup time and reduce duplicate queries, keeping formulas stable as teamwork increases.
How can auditors improve their results?
A final practical tip for auditors and reviewers is to add a tiny audit row near your results. This row should include three checks: the COUNT of numeric values, the number of non-numeric items, and whether any filters are active.
A single glance will indicate whether to trust the SD result or to start cleaning the data. This simple transparency saves meetings and reduces anxious back-and-forth.
How can AI tools help with Excel tasks?
Numerous is an AI-powered tool that helps content marketers, eCommerce businesses, and others do tasks repeatedly using AI. This includes writing SEO blog posts, generating hashtags, and categorizing products with sentiment analysis and classification. You can do all this just by dragging down a cell in a spreadsheet. With a simple prompt, Numerous can provide any spreadsheet function, whether it's easy or difficult, in just seconds.
Users can find out how to improve data hygiene and analysis by using Numerous’s ChatGPT for Spreadsheets. Our Spreadsheet AI Tool enhances your workflow by streamlining these tasks effortlessly.
While this addresses immediate errors, the underlying issues that hinder decision-making at scale still require attention.
Related Reading
Make Decisions At Scale Through AI With Numerous AI’s Spreadsheet AI Tool
When calculating standard deviation in Google Sheets, it’s important to show results in a way that is easy for colleagues to understand. Using the Numerous (spreadsheet AI tool) helps keep formulas and Apps Script helpers consistent across files and among reviewers.
This way, users can focus on understanding standard deviation and making decisions based on variation, rather than wasting time managing spreadsheets.